Земля от Пангеи до XXI века: континенты, города, население. Видеокарты
Оригинал взят у gorbutovich в Земля от Пангеи до XXI века: континенты, города, население. Видеокарты
Из серии: весь/вся/всё что-то за столько-то минут
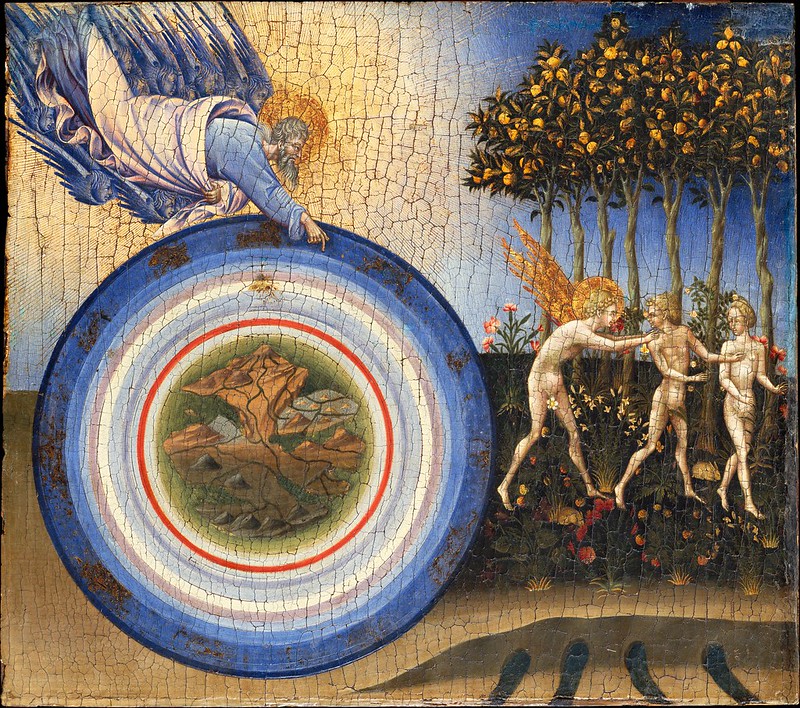
Джованни ди Паоло. Сотворение мира и Изгнание из рая. 1445. Музей Метрополитен, Нью-Йорк / Giovanni di Paolo (Giovanni di Paolo di Grazia) (Italian, Siena 1398-1482 Siena). The Creation of the World and the Expulsion from Paradise. Date: 1445. Tempera and gold on wood, 46.4 x 52.1 cm. The Metropolitan Museum of Art. Source
Видеокарты:
1. Рост населения Земли за последние 2000 лет за 3,5 минуты
2. Города мира от 3700 до н.э. до 2000 н.э. за 3 минуты
3. Континенты от Пангеи до настоящего времени за 12 секунд
Рост населения Земли за последние 2000 лет:
2.
Ролик, показывающий как население мира выросло за последние 2000 лет / Incredible video showing how world population has grown in the last 2,000 years. Video by worldpopulationhistory.org
Как возникали города мира:
3.
История городской цивилизации Земли за 3 минуты: видеокарта. Длительность: 03:21 / The History of Urbanization, 3700 BC - 2000 AD. This map visualizes the history of urban settlements over 6,000 years. Metrocosm. Source. [The data shown in the map comes from]The data shown in the map comes from a Yale-led study published in Scientific Data, which compiled the most comprehensive dataset on historical urban populations to date.
The data has a number of limitations and is “far from comprehensive.” Certain parts of world are better represented than others, and some well known cities do not appear until centuries after they were founded. That said, it is the first global-scale collection of pre-1950 urban populations, and a good starting point for future research.
Каждая точка на карте - это город со времени, когда появляются первые сведения о его населении, эта дата может не совпадать с датой его основания.
В карте первым городом, с 3700 года до н. э., показан Ур в междуречье Тигра и Евфрата. То, что Ур - первый город согласны не все ученые, но надо же с чего-то начинать.
4.
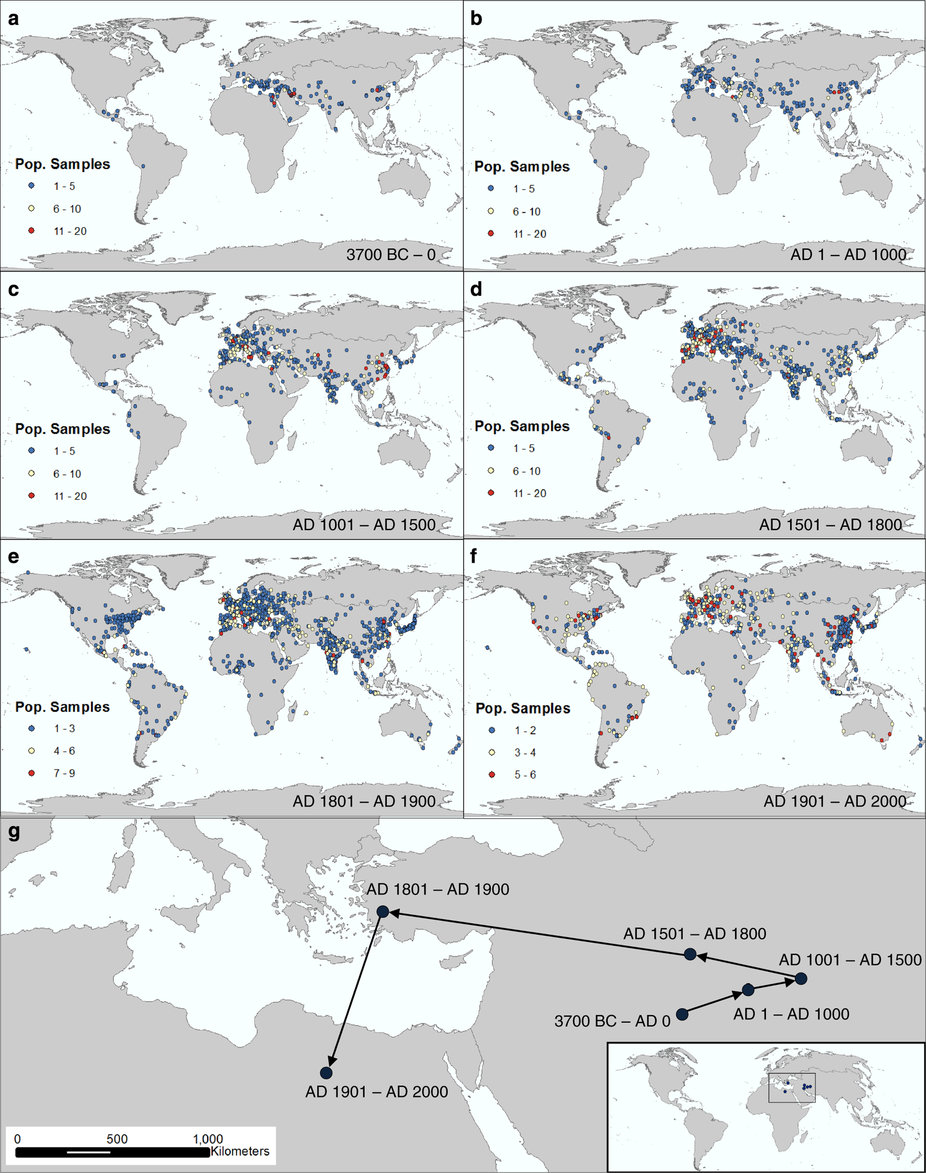
Изображение из статьи в Nature. Spatial and Temporal Representation-Global View of Data Points. (a-f) illustrate both the spatial and temporal frequency of city-level population points for different time periods. (a-d) represent the pre-modern period, from 3700 BC-AD 1800, and use the same scale to measure frequency of data points per city. (e,f) represent the modern period and shorter time frame per period and therefore the frequency scale is shorter and separated into thirds. (g) illustrates global mean centers (GMCs) for the same time periods. Each GMC is weighted by city population for each data point and was calculated and is pictured in the Goode Homolosine projection. Source
Подробности на Metrocosm и Nature: Metrocosm: Watch as the world’s cities appear one-by-one over 6,000 years. June 15, 2016
If you would like to go through the data yourself, you can find a spreadsheet for each original data source in the report: Nature: Spatializing 6,000 years of global urbanization from 3700 BC to AD 2000 // Scientific Data. 3, Article number: 160034 (2016)
Кратко на русском: Популярная Механика: История цивилизации за 3 минуты: видеокарта
5.

Краткая gif-версия: города с 500 г. до н.э по 150 г. до н.э. Metrocosm. Source
Континенты от Пангеи до настоящего времени:
6.
200 миллионов лет дрейфа континентов Земли - таймлапс. Длительность 00:12 / 200 million year timelapse of the Earth's continental drift. Map by EarthByte, portal.gplates.org, via Metrocosm
7.
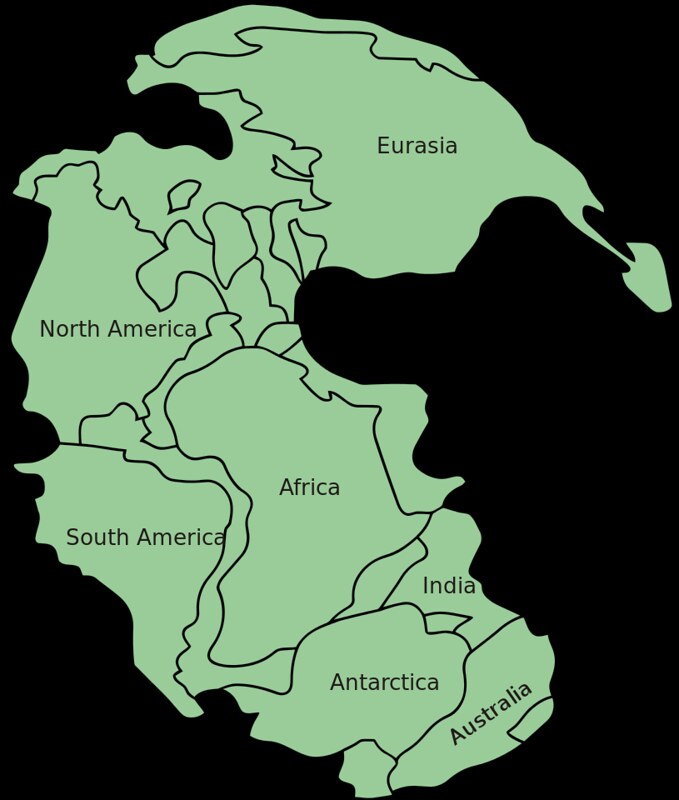
Пангея. Показаны контуры современных континентов. По теме см.: Сорохтин О.Г., Ушаков С.А. Развитие Земли. - М.: Изд-во МГУ, 2002. - 506 с. [PDF]
Ранее:
История Европы нашей эры за 7 минут. Границы, 2016-09-23
Китай исторический: столицы, хронология, карты, 2015-12-07 (видео: Динамика изменения границ Китая)
Карта Европы в разные времена. 814 - 1907 года, 2012-07-08
Из серии: весь/вся/всё что-то за столько-то минут

Джованни ди Паоло. Сотворение мира и Изгнание из рая. 1445. Музей Метрополитен, Нью-Йорк / Giovanni di Paolo (Giovanni di Paolo di Grazia) (Italian, Siena 1398-1482 Siena). The Creation of the World and the Expulsion from Paradise. Date: 1445. Tempera and gold on wood, 46.4 x 52.1 cm. The Metropolitan Museum of Art. Source
Видеокарты:
1. Рост населения Земли за последние 2000 лет за 3,5 минуты
2. Города мира от 3700 до н.э. до 2000 н.э. за 3 минуты
3. Континенты от Пангеи до настоящего времени за 12 секунд
Рост населения Земли за последние 2000 лет:
2.
Ролик, показывающий как население мира выросло за последние 2000 лет / Incredible video showing how world population has grown in the last 2,000 years. Video by worldpopulationhistory.org
Как возникали города мира:
3.
История городской цивилизации Земли за 3 минуты: видеокарта. Длительность: 03:21 / The History of Urbanization, 3700 BC - 2000 AD. This map visualizes the history of urban settlements over 6,000 years. Metrocosm. Source. [The data shown in the map comes from]The data shown in the map comes from a Yale-led study published in Scientific Data, which compiled the most comprehensive dataset on historical urban populations to date.
The data has a number of limitations and is “far from comprehensive.” Certain parts of world are better represented than others, and some well known cities do not appear until centuries after they were founded. That said, it is the first global-scale collection of pre-1950 urban populations, and a good starting point for future research.
Каждая точка на карте - это город со времени, когда появляются первые сведения о его населении, эта дата может не совпадать с датой его основания.
В карте первым городом, с 3700 года до н. э., показан Ур в междуречье Тигра и Евфрата. То, что Ур - первый город согласны не все ученые, но надо же с чего-то начинать.
4.
Изображение из статьи в Nature. Spatial and Temporal Representation-Global View of Data Points. (a-f) illustrate both the spatial and temporal frequency of city-level population points for different time periods. (a-d) represent the pre-modern period, from 3700 BC-AD 1800, and use the same scale to measure frequency of data points per city. (e,f) represent the modern period and shorter time frame per period and therefore the frequency scale is shorter and separated into thirds. (g) illustrates global mean centers (GMCs) for the same time periods. Each GMC is weighted by city population for each data point and was calculated and is pictured in the Goode Homolosine projection. Source
Подробности на Metrocosm и Nature: Metrocosm: Watch as the world’s cities appear one-by-one over 6,000 years. June 15, 2016
If you would like to go through the data yourself, you can find a spreadsheet for each original data source in the report: Nature: Spatializing 6,000 years of global urbanization from 3700 BC to AD 2000 // Scientific Data. 3, Article number: 160034 (2016)
Кратко на русском: Популярная Механика: История цивилизации за 3 минуты: видеокарта
5.
Краткая gif-версия: города с 500 г. до н.э по 150 г. до н.э. Metrocosm. Source
Континенты от Пангеи до настоящего времени:
6.
200 миллионов лет дрейфа континентов Земли - таймлапс. Длительность 00:12 / 200 million year timelapse of the Earth's continental drift. Map by EarthByte, portal.gplates.org, via Metrocosm
7.
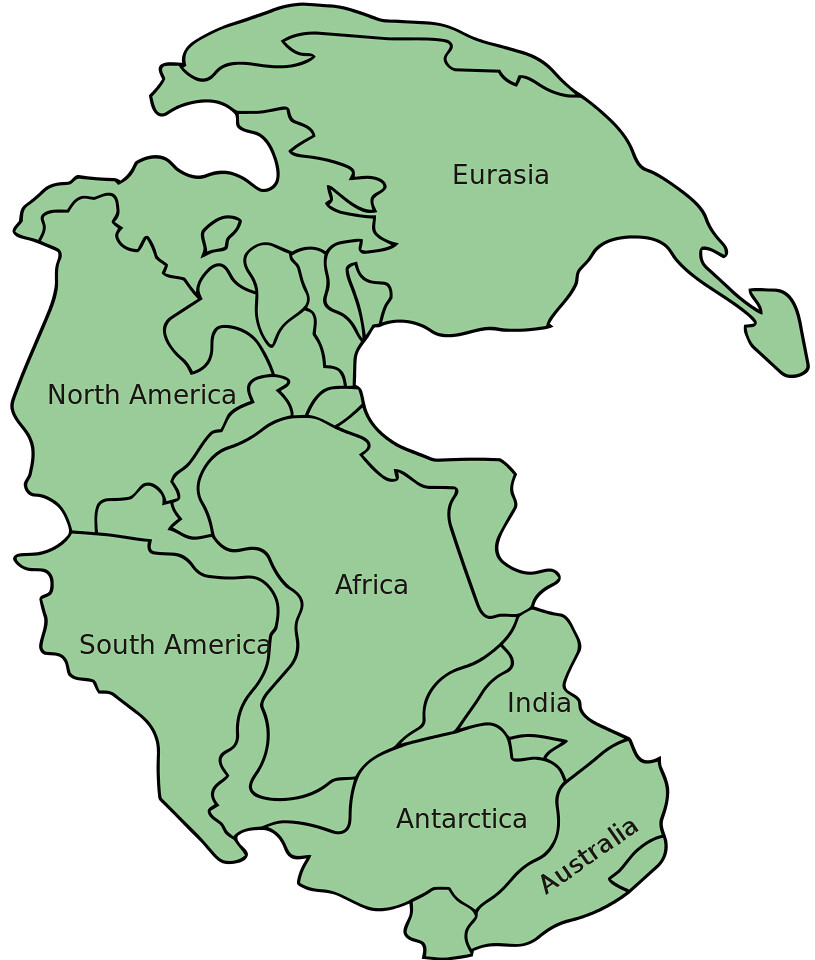
Пангея. Показаны контуры современных континентов. По теме см.: Сорохтин О.Г., Ушаков С.А. Развитие Земли. - М.: Изд-во МГУ, 2002. - 506 с. [PDF]
Ранее:
История Европы нашей эры за 7 минут. Границы, 2016-09-23
Китай исторический: столицы, хронология, карты, 2015-12-07 (видео: Динамика изменения границ Китая)
Карта Европы в разные времена. 814 - 1907 года, 2012-07-08