May Coincident Indexes Confirm "Deepst & Longest"
We've already known that by a complete basket of economic indicators (a basket far beyond just G.D.P., which is subject to massive revisions years later, and thus is never actually the indicator to watch, despite so much hype by mass media and financial press) the current recession has been the deepest since the dismantling that occurred when World War II ended, producing a very sharp eight month "V-shaped" recession in 1945.
What maybe has not been as clear to some, was whether or not the recession may have technically ended sometime in May, as so many green shooters have claimed. If the current recession came to a close in May, baring any changes to its start date, the duration may have been determined to be no longer than either the 73-75 or 81-82 slumps.
Based on two broad and highly accurate coincident indexes that have been made public this past week, it seems pretty clear that May heading into June was still very much a time of national recession. Furthermore, it also appears that whatever green shoot momentum there was in the April through mid May period tapered off a bit from mid May heading into the new month of June (which probably has at least something to do with why we are not seeing initial jobless claims decline off of their 4-week moving average peak of early April the way we have typically seen them do after all of their other end-of-recession peaks throughout that index's history).
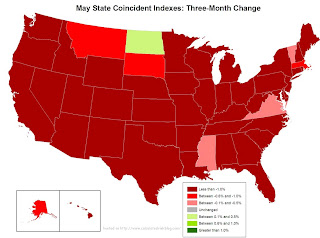
Philly Fed Index (h/t Calculated Risk)
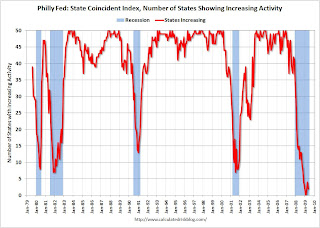
Philly Fed State Coincident Indicators: Widespread Recession


Click the above images for full size (Credits: Calculated Risk).
In the images above, and you can really make this out in the 50-state graph put together by CR, it is clear that the current recession continued to have a stranglehold on the nation heading into June.
Close examination of the Philly Fed Index over time shows that we've never technically been out of a recession before, at least not since the index began tracking them, until at least 20 states in the country were in recovery, and really, the count should be closer to 30. In May, 47 states showed declining activity, two states were flatlined, and one, and one state only, North Dakota, experienced any growth. Not exactly what one expects to see as confirmation that a national recession has ended.
The April green shoot showers did not bring May flowers theme continues with today's release of the Chicago Fed's National Activity Index (CFNAI):
The Chicago Fed National Activity Index (CFNAI) is a monthly index designed to better gauge overall economic activity and inflationary pressure. The CFNAI is released at 8:30 a.m. ET on scheduled days, normally toward the end of each calendar month.

Latest CFNAI News Release
May economic activity still weak
The Chicago Fed National Activity Index was −2.30 in May, little changed from −2.27 in April. All four broad categories of indicators made negative contributions to the index in May. (PDF,126KB)
Background on the CFNAI
The CFNAI is a weighted average of 85 existing monthly indicators of national economic activity. It is constructed to have an average value of zero and a standard deviation of one. Since economic activity tends toward trend growth rate over time, a positive index reading corresponds to growth above trend and a negative index reading corresponds to growth below trend.
What maybe has not been as clear to some, was whether or not the recession may have technically ended sometime in May, as so many green shooters have claimed. If the current recession came to a close in May, baring any changes to its start date, the duration may have been determined to be no longer than either the 73-75 or 81-82 slumps.
Based on two broad and highly accurate coincident indexes that have been made public this past week, it seems pretty clear that May heading into June was still very much a time of national recession. Furthermore, it also appears that whatever green shoot momentum there was in the April through mid May period tapered off a bit from mid May heading into the new month of June (which probably has at least something to do with why we are not seeing initial jobless claims decline off of their 4-week moving average peak of early April the way we have typically seen them do after all of their other end-of-recession peaks throughout that index's history).
Philly Fed Index (h/t Calculated Risk)
Philly Fed State Coincident Indicators: Widespread Recession


Click the above images for full size (Credits: Calculated Risk).
In the images above, and you can really make this out in the 50-state graph put together by CR, it is clear that the current recession continued to have a stranglehold on the nation heading into June.
Close examination of the Philly Fed Index over time shows that we've never technically been out of a recession before, at least not since the index began tracking them, until at least 20 states in the country were in recovery, and really, the count should be closer to 30. In May, 47 states showed declining activity, two states were flatlined, and one, and one state only, North Dakota, experienced any growth. Not exactly what one expects to see as confirmation that a national recession has ended.
The April green shoot showers did not bring May flowers theme continues with today's release of the Chicago Fed's National Activity Index (CFNAI):
The Chicago Fed National Activity Index (CFNAI) is a monthly index designed to better gauge overall economic activity and inflationary pressure. The CFNAI is released at 8:30 a.m. ET on scheduled days, normally toward the end of each calendar month.

Latest CFNAI News Release
May economic activity still weak
The Chicago Fed National Activity Index was −2.30 in May, little changed from −2.27 in April. All four broad categories of indicators made negative contributions to the index in May. (PDF,126KB)
Background on the CFNAI
The CFNAI is a weighted average of 85 existing monthly indicators of national economic activity. It is constructed to have an average value of zero and a standard deviation of one. Since economic activity tends toward trend growth rate over time, a positive index reading corresponds to growth above trend and a negative index reading corresponds to growth below trend.