Utility Rates and The Economy
One of the chief reasons I started this forum was that I was reared with a variation on the Mel Brooks maxim, "Hope for the best; expect the worst." Therefore, we should all simultaneously look forward to our bright and shiny futures . . . while making preparations for the darker days ahead. Utility rates are a perfect example of the best intentions gone horribly awry.
Here in the Pacific Northwest, most of our utilities rely on the steady fall of snow to provide the populace with potable water. Note that I said "snow," not rain. When it rains in the mountains, the snow pack is often washed away, sometimes earlier than the utility planners anticipated. These small surprise snow packs prompt emergency calls for conservation. Most comply. Sadly, after most manage to reduce water consumption by sometimes herculean effort, the utilities reward their community spirit by raising rates. Too little consumption hurts the bottom line, don't ya know.
Other factors hurt that bottom line. How about a dysfunctional economy? As an example, I've spent the last few days copying almost ten years worth of utility bills into my computer and playing with the results. Here's a graphical history of my water bill, for example:

Engrandize the Size
The two bottom-most factors, the Base Charge and Garbage, are billed (I think) the same in each household. The two upper factors, Water and Sewer, depend upon how much water we use in the billing period (we enjoy two month billing cycles around here). That Base Charge gets my goat. No matter how small the garbage can we choose, no matter that we use no water at all, that charge is unavoidable. I suppose this is necessary to balance the books at the utility; should too many conserve, they can make up the difference with increased base charges. Still, it's a grrrr-making number.
Some notable trends. The bills have increased in size, no denying that, more than doubling in 9 years. Some of that is our fault. Here's a breakdown of our water use in almost the same time period:
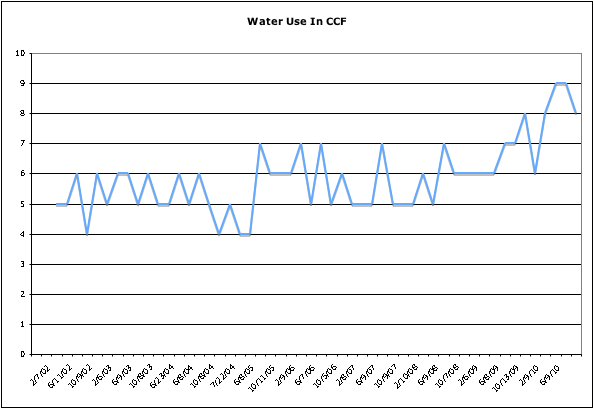
Not that it needs to be larger, but. . . .
(Water and sewer bills are tied to a meter that reads CCF, or cubic centi-foot. Imagine a square pool ten feet by ten feet filled with a foot of water. That's 748 gallons. It's a rough metric that leads to lots of spiking in the data, but it's the best measure we've got.)
You can see where we replaced the old toilet that came with the house; where the washers started failing before we noticed them; what time of year The Wife's™ family would visit; all the miscellaneous happenings that affect consumption. My goal, as stated in this forum, is not to worry about the use but try to devise strategies to make that use more and more affordable over time. Still, one can easily see how the increases and decreases in the consumption directly affected the two bill elements tied to consumption.
Today I finished graphing the other metric we need to explain the first graph of cost: the water rates over time. (Since the Base and Garbage charges aren't calculated based on any consumption rate, I didn't bother tracking them separately.)
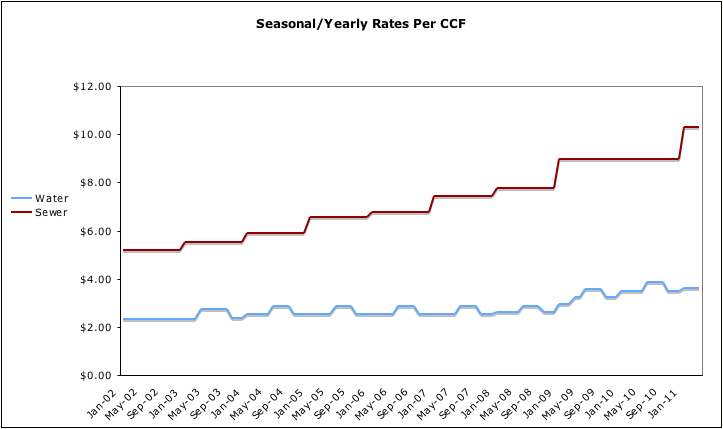
Em-big-enation.
As you can see, until recently both water and sewer rose pretty much with inflation. Water rates shifted regularly in the summer months (June through September); but the base Winter and Summer rates remained constant for quite some time. All that went to hell with the economy. That's where you can see the increased bumpy-ness in the water rate starting in 2009. That spike in sewer hits there as well. (By the way, water rates are set by the Seattle PUD; sewer piping and treatment is provided by King County.) One of the big increases was the hit to diesel in mid-2008; this would explain the huge jump in garbage collection and the base rate in early 2009 in the first graph. They put off raising the rates as long as they could, it seems, probably hoping the price of fuel would stabilize. It still runs ahead of inflation.
So, can I gather any conclusions from all this graphical goofing? First, no matter what you personally do at home, it looks like the cost of pouring, flushing and throwing away will increase. Which sucks if your income doesn't.
This leads to the second conclusion, that figuring out how much of an increase one can expect (answer: Who knows?) is vital to calculating the return on future home improvements that will reduce future consumption and thus these costs.
I've come up with a scheme (dashed only by the extreme freeze that hit us here four winters ago). I should soon have a description and pictures. Until then.
Here in the Pacific Northwest, most of our utilities rely on the steady fall of snow to provide the populace with potable water. Note that I said "snow," not rain. When it rains in the mountains, the snow pack is often washed away, sometimes earlier than the utility planners anticipated. These small surprise snow packs prompt emergency calls for conservation. Most comply. Sadly, after most manage to reduce water consumption by sometimes herculean effort, the utilities reward their community spirit by raising rates. Too little consumption hurts the bottom line, don't ya know.
Other factors hurt that bottom line. How about a dysfunctional economy? As an example, I've spent the last few days copying almost ten years worth of utility bills into my computer and playing with the results. Here's a graphical history of my water bill, for example:
Engrandize the Size
The two bottom-most factors, the Base Charge and Garbage, are billed (I think) the same in each household. The two upper factors, Water and Sewer, depend upon how much water we use in the billing period (we enjoy two month billing cycles around here). That Base Charge gets my goat. No matter how small the garbage can we choose, no matter that we use no water at all, that charge is unavoidable. I suppose this is necessary to balance the books at the utility; should too many conserve, they can make up the difference with increased base charges. Still, it's a grrrr-making number.
Some notable trends. The bills have increased in size, no denying that, more than doubling in 9 years. Some of that is our fault. Here's a breakdown of our water use in almost the same time period:
Not that it needs to be larger, but. . . .
(Water and sewer bills are tied to a meter that reads CCF, or cubic centi-foot. Imagine a square pool ten feet by ten feet filled with a foot of water. That's 748 gallons. It's a rough metric that leads to lots of spiking in the data, but it's the best measure we've got.)
You can see where we replaced the old toilet that came with the house; where the washers started failing before we noticed them; what time of year The Wife's™ family would visit; all the miscellaneous happenings that affect consumption. My goal, as stated in this forum, is not to worry about the use but try to devise strategies to make that use more and more affordable over time. Still, one can easily see how the increases and decreases in the consumption directly affected the two bill elements tied to consumption.
Today I finished graphing the other metric we need to explain the first graph of cost: the water rates over time. (Since the Base and Garbage charges aren't calculated based on any consumption rate, I didn't bother tracking them separately.)
Em-big-enation.
As you can see, until recently both water and sewer rose pretty much with inflation. Water rates shifted regularly in the summer months (June through September); but the base Winter and Summer rates remained constant for quite some time. All that went to hell with the economy. That's where you can see the increased bumpy-ness in the water rate starting in 2009. That spike in sewer hits there as well. (By the way, water rates are set by the Seattle PUD; sewer piping and treatment is provided by King County.) One of the big increases was the hit to diesel in mid-2008; this would explain the huge jump in garbage collection and the base rate in early 2009 in the first graph. They put off raising the rates as long as they could, it seems, probably hoping the price of fuel would stabilize. It still runs ahead of inflation.
So, can I gather any conclusions from all this graphical goofing? First, no matter what you personally do at home, it looks like the cost of pouring, flushing and throwing away will increase. Which sucks if your income doesn't.
This leads to the second conclusion, that figuring out how much of an increase one can expect (answer: Who knows?) is vital to calculating the return on future home improvements that will reduce future consumption and thus these costs.
I've come up with a scheme (dashed only by the extreme freeze that hit us here four winters ago). I should soon have a description and pictures. Until then.