US New Home Sales Fall to Record Low
The housing double dip in the United States kicked it up a notch last month, with new home sales hitting a fresh double dip record low.
Fears are rising that, combined with spiking consumer inflation rates mostly in the form of skyrocketing fuel and food prices (the things that the "rest" of us spend most of our "discretionary" dollars on), a stealth double dip recession may be imminent.
The Washington Times
'Worst report' on housing renews fears of recession
Within the space of a week, the nation has witnessed worst performances on record of new home sales, home prices and building - evidence that the housing market has sunk into a double-dip recession that poses a significant drag on the overall economy.
Never before has the U.S. economy staged a recovery while the housing market was in such a deep slump, although analysts are expecting it to defy the historical odds and maintain growth this year. But the news on housing in recent days is giving even the biggest optimists some pause.
The Commerce Department reported Wednesday that sales of new homes plummeted a breathtaking 16.9 percent last month to a record low annual rate of 250,000. On Monday, the National Association of Realtors found that prices of existing homes plunged again in every region of the country and are down by more than a third on average since the recession began.
Perhaps in the most dismal housing news to date, new starts and permits for residential housing construction nose-dived to the lowest levels in more than half a century of record-keeping, Commerce reported last week, in what one economist described as the “worst report” he has ever seen on housing.
“The new and existing housing markets are in a very precarious situation,” said Chris G. Christopher, an economist at IHS Global Insight. “The bottom line is extremely simple to interpret. The housing market is still very depressed and a major drag on the economy.” ...
Calculated Risk
New Home Sales Fall to Record Low in February
The Census Bureau reports New Home Sales in February were at a seasonally adjusted annual rate (SAAR) of 250 thousand. This was down from a revised 301 thousand in January.

Click on graph for larger image in graph gallery.
The first graph shows New Home Sales vs. recessions since 1963. The dashed line is the current sales rate.
Sales of new single-family houses in February 2011 were at a seasonally adjusted annual rate of 250,000 ... This is 16 9 percent 16.9 (±19.1%)* below the revised January rate of 301,000 and is 28.0 percent (±14.8%) below the February 2010 estimate of 347,000.
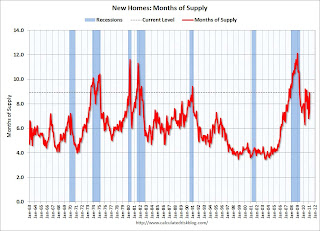
And a long term graph for New Home Months of Supply:

Months of supply increased to 8.9 in February from 7.4 months in January. The all time record was 12.1 months of supply in January 2009. This is very high (less than 6 months supply is normal)....
Fears are rising that, combined with spiking consumer inflation rates mostly in the form of skyrocketing fuel and food prices (the things that the "rest" of us spend most of our "discretionary" dollars on), a stealth double dip recession may be imminent.
The Washington Times
'Worst report' on housing renews fears of recession
Within the space of a week, the nation has witnessed worst performances on record of new home sales, home prices and building - evidence that the housing market has sunk into a double-dip recession that poses a significant drag on the overall economy.
Never before has the U.S. economy staged a recovery while the housing market was in such a deep slump, although analysts are expecting it to defy the historical odds and maintain growth this year. But the news on housing in recent days is giving even the biggest optimists some pause.
The Commerce Department reported Wednesday that sales of new homes plummeted a breathtaking 16.9 percent last month to a record low annual rate of 250,000. On Monday, the National Association of Realtors found that prices of existing homes plunged again in every region of the country and are down by more than a third on average since the recession began.
Perhaps in the most dismal housing news to date, new starts and permits for residential housing construction nose-dived to the lowest levels in more than half a century of record-keeping, Commerce reported last week, in what one economist described as the “worst report” he has ever seen on housing.
“The new and existing housing markets are in a very precarious situation,” said Chris G. Christopher, an economist at IHS Global Insight. “The bottom line is extremely simple to interpret. The housing market is still very depressed and a major drag on the economy.” ...
Calculated Risk
New Home Sales Fall to Record Low in February
The Census Bureau reports New Home Sales in February were at a seasonally adjusted annual rate (SAAR) of 250 thousand. This was down from a revised 301 thousand in January.

Click on graph for larger image in graph gallery.
The first graph shows New Home Sales vs. recessions since 1963. The dashed line is the current sales rate.
Sales of new single-family houses in February 2011 were at a seasonally adjusted annual rate of 250,000 ... This is 16 9 percent 16.9 (±19.1%)* below the revised January rate of 301,000 and is 28.0 percent (±14.8%) below the February 2010 estimate of 347,000.
And a long term graph for New Home Months of Supply:

Months of supply increased to 8.9 in February from 7.4 months in January. The all time record was 12.1 months of supply in January 2009. This is very high (less than 6 months supply is normal)....