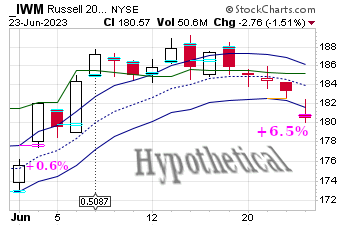
The green line is too skittish

I didn’t take this short trade and I didn’t get the +6.5% gain shown here, not even in my imaginary hobby game spreadsheet. Back on Jun 02, I wrote “The green line got pierced today, so the market is rising rapidly and I should not bet against it with a SELL-SHORT order.” Well, the green line scares me off many trades that actually would have been perfectly profitable; there are some occasional very nasty ones that it saves me from. The line is just a guess as to what might count as “rising too fast”, based on the formula MIN(22)+4*ATR(22). I used to use 6*ATR in this formula, same as for the red line, but that didn’t trigger soon enough and I wasn’t saved - so I pulled the replacement coefficient 4 out of my butt. Remember, folks, you’re watching 🐔 🪛 ⚾ (The Crank Channel)
On Jun 22, price got down to only 6¢ (that’s 0.036%) above my blue line without actually touching it. I debated calling that ‘close enough’ and then beginning the long trade on Jun 23, but I didn’t. We’ll see if my next imaginary stock-purchase happens tomorrow. Short-selling remains off the table, due to the recent piercing of the green line, even though that overlay has failed me here yet again.
On Jun 07 there was a dividend issued of nearly 51¢ per share. I don’t normally show dividend payments on these charts, nor do I account for them in my spreadsheet. Back when I used Interactive Brokers paper trading, I treated their imaginary dividend payments as random events that gave me undeserved extra money, due to long positions I happened to have been holding weeks earlier. I don’t recall ever having to pay dividends, even though that is supposed to happen if you are short coming into ex-dividend day. I also don’t account for interest on cash balances (over 4½% now at IB!), margin interest (7½%), nor the fee for borrowing shares (¼% per day, so 62½% annualized); all of these were around 0% for many years but have become significant again since the last time I did any real-money trading.
I wasn’t aware, until just now when I looked it up, just how gigantic the borrowed-shares fee is. That makes my simulation quite unrealistic. The margin rate seems reasonable to enable going beyond 100% long for a week or two, but the borrowed-shares fee means a short trade that drags on for a month would yield significantly less than my charts are showing. Perhaps some improvement in simulation accuracy is warranted.