Climates
This started out as a short comment in a friend’s blog, but got out of control.
It is easy to get timescales mixed up, and associate the gradual movement of continents with the rise of sea levels.
Continental drift takes place over tens of millions of years. It is a very slow-moving process. the various pieces move apart into separate small continents (as they are now) and come back together into supercontinents, and this cycle is a few hundred million years long. This affects climate, producing effects seen here for the last half-billion years or so, representing the time of spreading across the continents. At the beginning of that time, there were “forests” along the ocean edges - but they were only an inch tall:
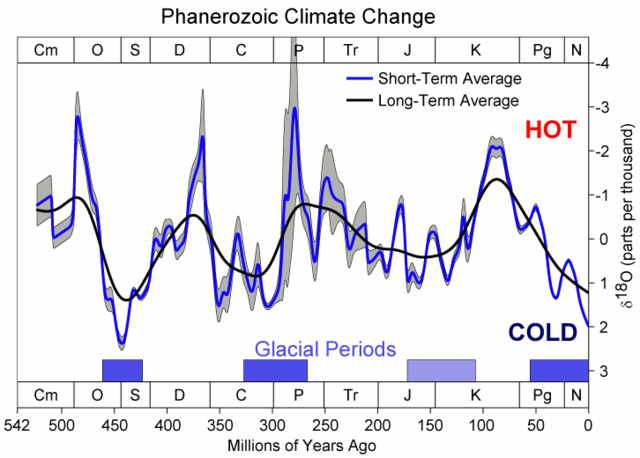
As you can see, we’re in a pretty cold phase, but this rate of change is very slow and ponderous as the continental pieces dance around.
Sea-level change is much faster. But let’s sneak up on this. If we expand the last ten percent or so of the above chart, and just look at the time since the big impact 65 million years ago, temperatures look like this:

The Fertile and Warm Eocene
The Earth was, on average, several degrees warmer and had much higher CO2 than today, which is at the right of the above chart. These were fertile times, and gigantic mammals grew in the sea and on land, replacing the gigantic dinosaurs that previously occupied those niches. Life was abundant indeed, from an abundance of small mammals to titanotheres that dwarfed modern elephants:

Antarctica was warmer, and connected to South America by a land bridge. The remains of this bridge, the old ends, are still evident, and you can see the great mud flows in Google Earth views of the ocean below South America when the water broke through.

This opening allowed a southern “circumpolar” current that cut off Antarctica and cooled it rapidly, creating the massive stable ice sheets still there today.
But amid the fluctuations as continents moved around, something else began happening in the last several million years. Something drove the Earth colder yet. What happened? In short, Central America.
While there had been ice ages in the very distant past, the last fifty million years had been quite nice. Up to about five million years ago, there was no ice age cycle. There was fairly little ice up north, but a lot in Antarctica due to that separate current that had been keeping it cool for tens of millions of years. So the Earth was generally warm - much warmer than today - and the northern temperate region extended very far north. North and South America were recognizable, but a gap of ocean stretched between current-day Mexico and South America’s Columbia.
But volcanoes, part of the famed Ring of Fire, began erupting in earnest in the gap between North and South America. The Gulf Stream’s former flow effects can still be seen in Google Earth. As the gap narrowed, you can see where the last of the Gulf Stream pushed through in the areas now occupied by Costa Rica and Panama, and the delta of mud from this constricted flow extends hundreds of miles into the ocean:

The volcanoes in the area that would be Central America built islands, then the spaces between islands closed off from more lava flow. As the gap between the two large continents was gradually choked off, the entire Earth’s temperature started dropping, and glacial cycles began. They were initially less severe, more irregular, and more frequent, as a slow flow still made it through the gap; and the glacial cycles stabilized (roughly) around every 40,000 years or so. Still a bit warmer on average during the peak than today’s times.
Finally, Central America is Complete
The trickle through the new, still-steaming Central America finally stopped as the last gaps were filled. The Earth overall cooled further as the Gulf Stream finally was entirely forced to go north into the Arctic Zone. Ice cycles fell into their current 100,000 years, and have been fairly stable since then.
Let’s do it again, and take about ten percent of the previous temperature chart. Current time is at the right:

The timing is not precise, and the closer you look at those cycles, the more ragged they seem as we’ll see shortly. We are toward the warm end in this ragged cycle, but overall, still in a cold period as you’ll remember from the previous chart. We don’t know how long this time on the peak will last: We could start dropping today. We could keep our somewhat warm period for another ten or fifteen thousand years, perhaps.
(And for drastic measure, we could move everyone out of Central America and blast it open again with hydrogen bombs. This would be hard to sell, I think, but would likely return the entire planet to warmer, more fertile times. That, truly, would be Man-made Global Warming.)
The Seas will Fall Eventually
The pattern is clear. The glaciation will return, with the sea dropping hundreds of feet as ice is formed thousands of feet thick over great stretches of the northern continents. Below is a sea-level chart for the last several glaciations, not quite a million years, and an expansion of the last 125,000 years.
Note that humans were expanding out of Africa and spreading across the globe during this latter time, and had expanded in waves several times over the longer chart, with newer waves often replacing older ones. There may well be a connection between these waves of humans and the periodic warming of the Earth.
The chart scale is about 400 feet of sea level, top to bottom, and unlike the five million year chart above, this one has today at the far left:
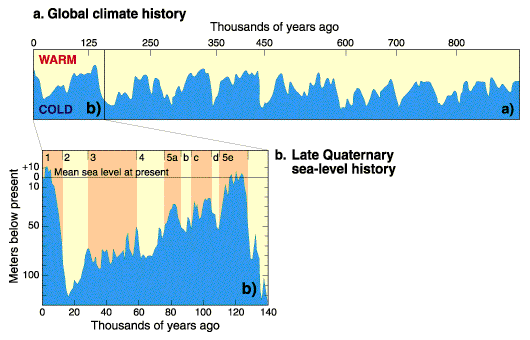
Current time is the far left. Note that we’re now at about the peak, and in fact a bit past the peak, of the current cycle, and the cycles are ragged. The peaks don’t last long, but they’ve been getting gradually higher over the past million years. The peaks tend to last only a few thousand years, then the long slide into continental glaciation begins again. Bad weather, we would call it. Long winters, then unending winters, then sheets of ice covering our current northern cities from Chicago to London.
Peaks and Warming
At the end of the last long winter, humans arrived in North America across that low-ocean land bridge from current-day Russia. Since then, they’ve seen the oceans rise more than 300 feet from glacier melt. Most of this is now done: Seas are now rising at only about six inches per century, and tide gauges show that this rate is remaining stable into the 21st century (despite wild-eyed predictions otherwise and tweaked satellite records that ignore actual tide gauges).
Humans may, in fact, be helping to stay on the warm and fertile peak somewhat, though additional carbon dioxide has a minor effect. We might stay on this peak, or better yet get a little warmer, for tens of thousands of years yet. The worst predictions from models have the Earth warming to the green and pleasant climes of the time prior to the Gulf Stream re-routing. The warming is hardly threatening, but the long winter between peaks certainly is.
There is no chance, none, of “runaway warming” as we are barely at one-twentieth of the CO2 we had when life began colonizing the land. Doubling it would hardly be noticeable in a long-term chart of CO2. And the feedbacks that have kept the Earth stable for billions of years are still operating.
Feed the Poor Plants
Plants have been using up the CO2, and are suffocating as a result. They evolved for a much-higher-CO2 atmosphere. Humans, putting some of this consumed CO2 back into the atmosphere from fossilized plants, are actually improving the environment and helping plant growth dramatically. We see it in crop yields, and in the amazingly increasing biosphere of the world’s greenery as measured by satellite. The Earth now sports an estimated three-plus trillion trees.
And as the quantity of CO2 increases, the effect of each added unit reduces as saturation effects occur. If the atmosphere is already completely trapping a particular frequency of sunlight, more CO2 won’t trap any more. The effects of clouds and water vapor are far larger than CO2, and there is an evident feedback cycle between these that has kept things fairly stable for billions of years, from the time that the air was mostly CO2 to today’s time of being down to 0.04% CO2, with broad fluctuations of CO2 following climate changes, not causing them.
Modeling Doomsday
To serve the purposes of catastrophists, models are created to predict doom. I’ve been playing with financial models since the 1970s and had excellent success with them, and I am familiar with the process of getting models to produce the results you want.
And the models making predictions about climate have been shown to be badly exaggerating. To this, I say “of course!” Any model runs that produced smaller (more realistic) effects were discarded, and the models tweaked to produce more drama. Think about what this means: Models that correctly predicted stable temperatures were discarded as they did not match the desired narrative. Had they been kept, they would have been shown to be more accurate … if less lucrative. Good news is not the panic that is needed for fundraising - and control-grabbing.
It is sad to see what the current crop of catastrophists have done to the practice of science. The temperature, ice, ocean alkalinity and other records are methodically “improved” or selectively neglected to make modern times seem bad compared to history, and then ridiculous and ever-more-strident predictions are made to justify immediate action. But the predictions and blame are in all directions:
After the outlandish predictions of snowless winters failed to materialize, the [UK’s Climate Research Unit] dramatically changed its tune on snowfall. All across Britain, in fact, global-warming alarmists rushed to blame the record cold and heavy snow experienced in recent years on - you guessed it! - global warming. Less snow: global warming.
Lobsters will be bigger because of global warming. Lobsters will be smaller because of global warming. They’ll be more abundant. And scarcer. All due to global warming and which wrong model the researchers decided to hype. The same process applies to a thousand different predicted disasters.
And crops are always predicted to fail - but crop yields rise steadily around the globe, even in areas unable to take advantage of modern agricultural techniques. A rising CO2 lifts all crop yields, and improvements in agriculture add even more. We need this for the world’s increasing population.
Climate Extremes
But what are the actual results of “climate extremes”? Hurricanes have dropped in overall power, and the lack of US landfalls of major hurricanes has created the longest no-major-hurricane streak since we’ve been keeping records. The “superstorm” Sandy was broad, but barely a hurricane when it hit.
A repeat of the hurricanes of the early 20th century that clobbered New York and its region would be far worse today. President Obama’s administration has seen no major hurricanes hit the US, and only three total. President Grover Cleveland saw three major hurricanes hit the US in six weeks, and 26 total hurricanes. FDR also saw 26 hurricanes during his longer tenure. Here’s the hurricane count by administration.
Tornadoes are much the same; the frequency of major tornadoes is now at near-record lows. We see more small tornadoes now because we have sensors like Doppler radar that track them, and that did not exist decades ago. But strong tornadoes have been gradually declining over the past 60 years

Charts looking at the data in different ways show the last few years at rock bottom. This is tricky to measure because of improvements in instrumentation, and different ways of describing modern tornadoes (Fujita Scale became Enhanced Fujita Scale about twenty years ago). And we change the methods of guessing at past tornadoes. But despite the lower human populations in the 19th and 20th centuries, there were far more deaths and more destruction from tornadoes then. Only one of the most destructive 20 US tornadoes has been in the 21st century.
The lack of death and destruction seems disappointing to the catastrophists. California just finished a roughly four-year drought. But when Europeans first arrived here, California’s droughts were a century or more. We’ve been fortunate.
The Effect of Mankind
I’ve already mentioned the beneficial effect of mankind putting a bit of that fossil CO2 back into the atmosphere. But some make another assertion: Man’s activities are too “puny” to produce any significant impact. I don’t quite agree with this. Besides the modest benefits from CO2, negatives are possible: A full nuclear war, for example, would produce smoke and cloud patterns that would likely kick off the next cycle of glaciation, and in the very short term perhaps eliminate the ability to grow crops for some period of one to five years. That’s enough to wipe almost all of us out, the ones that survived the US-Russia-China-Pakistan-India-Iran-Israel-North Korean exchange of warheads. While not “permanent,” the effect upon climate would be deadly enough.
Looking at the overall image of climate over millions of years past, more carbon dioxide takes us in a better direction. Of course, this minor effect is easily swamped by other cycles that span tens of years (called decadal oscillations).
Looking forward
It would be nice if the CO2 effect were larger: Humans came over the land bridge during very cold times, but as they colonized the warming North America, the Arctic was free of ice in summer for thousands of years. Good times. The peoples from those times would be amazed that we sit in our cooler climes and are fearful of a return to more productive and more compatible temperatures.
Maybe Man’s activities can keep us on that peak temperature or better for thousands of years longer. The alternative, the long winter, is grim.
===|==============/ Keith DeHavelle