(no subject)
The Gold/US Dollar Ratio At Major Support
by Donald W. Pendergast Jr.
After completing a major third wave up, the gold/US dollar ratio sits right at major support, which may also be the low of corrective wave A.
Security: GC#F, DX#F
Position: Accumulate
As recently as March 2008, the sky seemed like the limit for gold, even as dollar pessimism reached historic proportions. In a moment, however, everything seemed to get turned upside down as gold faltered and the dollar rallied. What happened? Did the fundamentals that drove gold from $252 to $1,030 suddenly turn bearish? What changed in the dollar's long-term outlook to make it climb so sharply?
In essence, nothing changed at all. All of the fundamental factors are in place and are stronger than ever. What happened is that the mania phase of an especially strong up wave 3 in gold ran its course and then corrected sharply (it's still in the process of doing so, and may be for months). Similarly, the ultrabear mania that drove the dollar into the dirt also abated, leading to the massive short-covering rally that may be nearing its terminal phase.
Elliott wavers know that extremes in social mood are the driving force behind every market move, and those moves can be accurately identified, quantified, and most important, profited from. We'll start with the monthly gold/US dollar ratio chart.

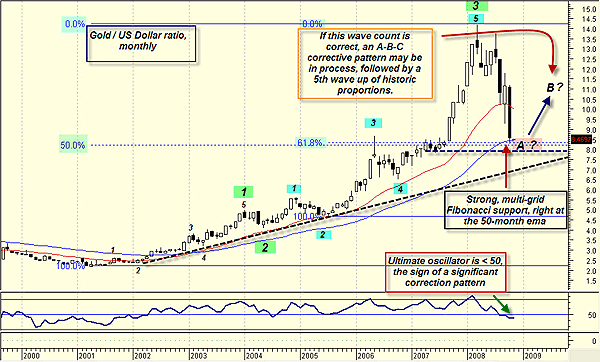
FIGURE 1: GOLD/US DOLLAR RATIO, MONTHLY. Three powerful waves up, followed by a correction. Graphic provided by: MetaStock.
The Elliott wave labeling on Figure 1 is self-explanatory; the most logical conclusion right now is that the gold/dollar ratio is nearing completion of corrective wave A, which happens to be near a confluence of Fibonacci support and the 50-month exponential moving average (EMA). If waves B and C follow, there should be several more opportunities to profit from gold and the US dollar as they react, reverse, and rally. However, if and when the corrective waves are complete, a break higher by gold means the start of a fifth wave, one that has the potential to become the most profitable phase of this historic bull run in gold.

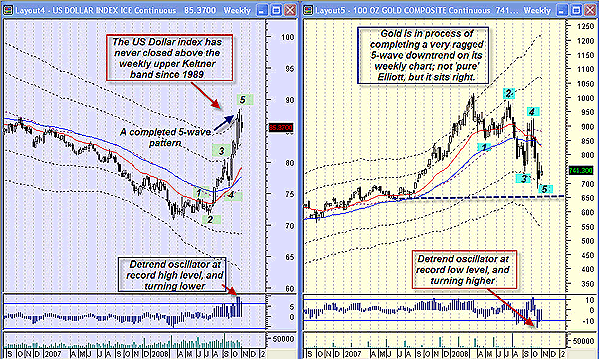
FIGURE 2: US DOLLAR. An extended fifth wave in the US dollar; a correction is likely. Graphic provided by: MetaStock. Graphic provided by: WB Detrend EOD from Profit Trader for MetaStock.
A side-by-side view of the weekly US Dollar Index and gold futures contracts also reveals the hand of R.N. Elliott at work -- the beautiful Elliott pattern, featuring an extended fifth wave in the US dollar appears to be complete, even as the detrend (near a record high) begins to turn southward, right near its upper Keltner band (Figure 2). A corrective wave should take the greenback down to at least 78 to 80 within a few weeks. Meanwhile, even gold has traced out a raggedy five-wave corrective pattern on its weekly chart; unlike the dollar, the fifth wave in gold appears to be truncated. If the dollar rolls over hard, expect gold to reciprocate by staging a strong rally, probably back toward $800-875.
The battle between the US dollar and gold continues, just as it has since President Richard Nixon officially terminated the exchange of dollars for gold back in August 1971. Since then, the world has been on a floating exchange-rate standard, even as deficit spending continues unabated and the national debt has grown to astronomical levels. Some predict that gold's best days are just ahead, while others simply write it off as just another commodity bubble. Whichever way gold and the US dollar go, the charts will be the trader's most accurate guide as this global money war continues. Meanwhile, I rate gold as an accumulate and the US dollar as a sell.
=========================================
ФИГУРА 2: доллар США. Расширенная пятая волна в долларе США; исправление вероятно.
Маркировка волны Эллиотта на иллюстрации 1 очевидна; самое логическое заключение прямо сейчас - то, что золотое/долларовое отношение приближается к завершению корректирующей волны A, который, случается, около слияния поддержки Fibonacci и 50-месячного показательного скользящего среднего значения (Европейское валютное соглашение). Если волны B и C следуют, должен быть несколько больше возможностей получить прибыль от золота и доллара США, как они реагируют, полностью изменяют, и собрание. Однако, если и когда корректирующие волны полны, перерыв выше золотом означает начало пятой волны, тот, который имеет потенциал, чтобы стать самой выгодной фазой этого исторического быка, которым управляют в золоте.
ФИГУРА 2: доллар США. Расширенная пятая волна в долларе США; коррекция вероятно.
Бок о бок представление еженедельного Индекса доллара США и золотых фьючерсных контрактов также показывает руку R.N. Эллиотт на работе - красивый образец Эллиотта, показывая расширенную пятую волну в долларе США, кажется, полный, как раз когда detrend (около рекордно высокого уровня) начинает стать движущимся на юг, правильным около его верхней полосы Keltner (иллюстрация 2). Корректирующая волна должна снять доллар к по крайней мере 78 - 80 в течение нескольких недель. Тем временем, даже золото проследило изношенный корректирующий образец с пятью волнами на его еженедельной диаграмме; в отличие от доллара, пятая волна в золоте, кажется, обрезанная. Если доллар переворачивается трудно, ожидайте, что золото оплатит, организовывая сильное собрание, вероятно назад к $800-875.
Сражение между долларом США и золотом продолжается, так же, как это имеет, так как Президент Ричард Никсон официально закончил обмен долларами для золота назад в августе 1971. С тех пор, мир был по плавающему стандарту обменного курса, как раз когда расходы дефицита продолжаются неустанный, и государственный долг рос к астрономическим уровням. Некоторые предсказывают, что лучшие дни золота - только вперед, в то время как другие просто списывают это как только другой товарный пузырь. Какой бы ни способ, которым золото и доллар США идут, диаграммы, будет самым точным гидом торговца, поскольку эта глобальная война денег продолжается. Тем временем, я оцениваю золото как накапливание и доллар США как продавание.
by Donald W. Pendergast Jr.
After completing a major third wave up, the gold/US dollar ratio sits right at major support, which may also be the low of corrective wave A.
Security: GC#F, DX#F
Position: Accumulate
As recently as March 2008, the sky seemed like the limit for gold, even as dollar pessimism reached historic proportions. In a moment, however, everything seemed to get turned upside down as gold faltered and the dollar rallied. What happened? Did the fundamentals that drove gold from $252 to $1,030 suddenly turn bearish? What changed in the dollar's long-term outlook to make it climb so sharply?
In essence, nothing changed at all. All of the fundamental factors are in place and are stronger than ever. What happened is that the mania phase of an especially strong up wave 3 in gold ran its course and then corrected sharply (it's still in the process of doing so, and may be for months). Similarly, the ultrabear mania that drove the dollar into the dirt also abated, leading to the massive short-covering rally that may be nearing its terminal phase.
Elliott wavers know that extremes in social mood are the driving force behind every market move, and those moves can be accurately identified, quantified, and most important, profited from. We'll start with the monthly gold/US dollar ratio chart.

FIGURE 1: GOLD/US DOLLAR RATIO, MONTHLY. Three powerful waves up, followed by a correction. Graphic provided by: MetaStock.
The Elliott wave labeling on Figure 1 is self-explanatory; the most logical conclusion right now is that the gold/dollar ratio is nearing completion of corrective wave A, which happens to be near a confluence of Fibonacci support and the 50-month exponential moving average (EMA). If waves B and C follow, there should be several more opportunities to profit from gold and the US dollar as they react, reverse, and rally. However, if and when the corrective waves are complete, a break higher by gold means the start of a fifth wave, one that has the potential to become the most profitable phase of this historic bull run in gold.

FIGURE 2: US DOLLAR. An extended fifth wave in the US dollar; a correction is likely. Graphic provided by: MetaStock. Graphic provided by: WB Detrend EOD from Profit Trader for MetaStock.
A side-by-side view of the weekly US Dollar Index and gold futures contracts also reveals the hand of R.N. Elliott at work -- the beautiful Elliott pattern, featuring an extended fifth wave in the US dollar appears to be complete, even as the detrend (near a record high) begins to turn southward, right near its upper Keltner band (Figure 2). A corrective wave should take the greenback down to at least 78 to 80 within a few weeks. Meanwhile, even gold has traced out a raggedy five-wave corrective pattern on its weekly chart; unlike the dollar, the fifth wave in gold appears to be truncated. If the dollar rolls over hard, expect gold to reciprocate by staging a strong rally, probably back toward $800-875.
The battle between the US dollar and gold continues, just as it has since President Richard Nixon officially terminated the exchange of dollars for gold back in August 1971. Since then, the world has been on a floating exchange-rate standard, even as deficit spending continues unabated and the national debt has grown to astronomical levels. Some predict that gold's best days are just ahead, while others simply write it off as just another commodity bubble. Whichever way gold and the US dollar go, the charts will be the trader's most accurate guide as this global money war continues. Meanwhile, I rate gold as an accumulate and the US dollar as a sell.
=========================================
ФИГУРА 2: доллар США. Расширенная пятая волна в долларе США; исправление вероятно.
Маркировка волны Эллиотта на иллюстрации 1 очевидна; самое логическое заключение прямо сейчас - то, что золотое/долларовое отношение приближается к завершению корректирующей волны A, который, случается, около слияния поддержки Fibonacci и 50-месячного показательного скользящего среднего значения (Европейское валютное соглашение). Если волны B и C следуют, должен быть несколько больше возможностей получить прибыль от золота и доллара США, как они реагируют, полностью изменяют, и собрание. Однако, если и когда корректирующие волны полны, перерыв выше золотом означает начало пятой волны, тот, который имеет потенциал, чтобы стать самой выгодной фазой этого исторического быка, которым управляют в золоте.
ФИГУРА 2: доллар США. Расширенная пятая волна в долларе США; коррекция вероятно.
Бок о бок представление еженедельного Индекса доллара США и золотых фьючерсных контрактов также показывает руку R.N. Эллиотт на работе - красивый образец Эллиотта, показывая расширенную пятую волну в долларе США, кажется, полный, как раз когда detrend (около рекордно высокого уровня) начинает стать движущимся на юг, правильным около его верхней полосы Keltner (иллюстрация 2). Корректирующая волна должна снять доллар к по крайней мере 78 - 80 в течение нескольких недель. Тем временем, даже золото проследило изношенный корректирующий образец с пятью волнами на его еженедельной диаграмме; в отличие от доллара, пятая волна в золоте, кажется, обрезанная. Если доллар переворачивается трудно, ожидайте, что золото оплатит, организовывая сильное собрание, вероятно назад к $800-875.
Сражение между долларом США и золотом продолжается, так же, как это имеет, так как Президент Ричард Никсон официально закончил обмен долларами для золота назад в августе 1971. С тех пор, мир был по плавающему стандарту обменного курса, как раз когда расходы дефицита продолжаются неустанный, и государственный долг рос к астрономическим уровням. Некоторые предсказывают, что лучшие дни золота - только вперед, в то время как другие просто списывают это как только другой товарный пузырь. Какой бы ни способ, которым золото и доллар США идут, диаграммы, будет самым точным гидом торговца, поскольку эта глобальная война денег продолжается. Тем временем, я оцениваю золото как накапливание и доллар США как продавание.