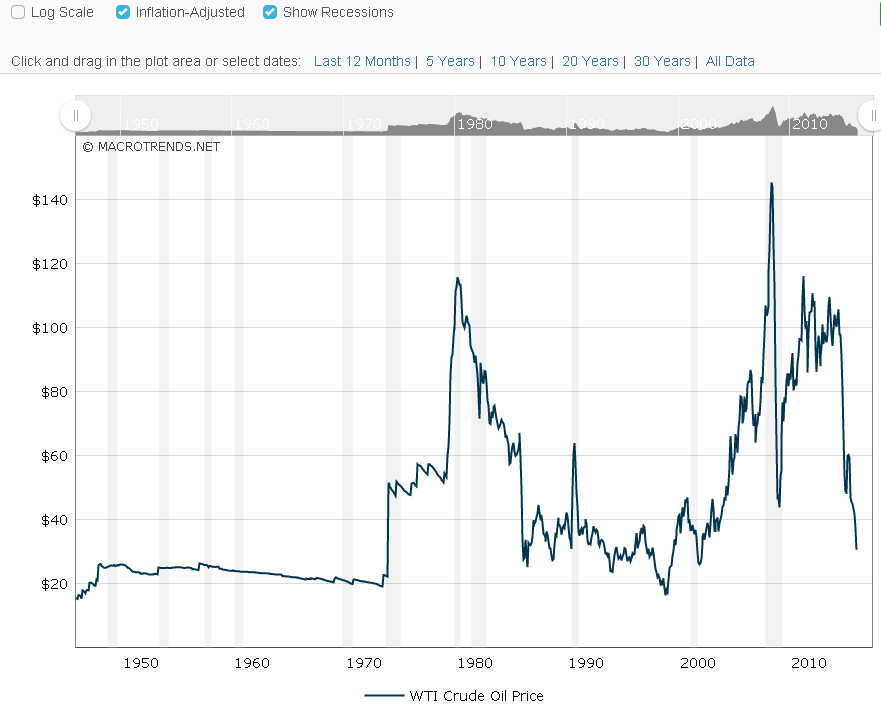
Crude Oil Price History Chart // macrotrends.net
Interactive chart of historical monthly West Texas Intermediate (WTI or NYMEX) crude oil prices per barrel back to 1948. The price of oil shown is adjusted for inflation using the headline CPI and is shown by default on a logarithmic scale.
Data Sources: Energy Information Administration, BLS
http://www.macrotrends.net/1369/crude-oil-price-history-chart
Номинальные цены, линейная шкала


Цены с поправкой на инфляцию, логарифмическая шкала

Data Sources: Energy Information Administration, BLS
http://www.macrotrends.net/1369/crude-oil-price-history-chart
Номинальные цены, линейная шкала


Цены с поправкой на инфляцию, логарифмическая шкала
